Explore
DranSCADA's dashboard UI is all about building dashboards for visualization. Explore strips away all the dashboard and panel options so that you can focus on the query. Iterate until you have a working query and then think about building a dashboard.
Explore is only available in DranSCADA 6.0 and above.
For infrastructure monitoring and incident response, you no longer need to switch to other tools to debug what went wrong. Explore allows you to dig deeper into your metrics and logs to find the cause. This creates a new debugging workflow where you can:
- Receive an alert
- Drill down and examine metrics
- Drill down again and search logs related to the metric and time interval (and in the future, distributed traces)
If you just want to explore your data and do not want to create a dashboard, then Explore makes this much easier. If your data source supports graph and table data, then Explore shows the results both as a graph and a table. This allows you to see trends in the data and more details at the same time.
Note: By default, users with the Viewer role cannot edit and do not have access to Explore. Refer to Organization roles for more information about what each role has access to.
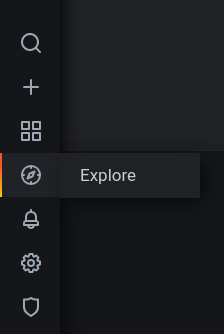
There is an Explore icon on the menu bar to the left. This opens an empty Explore tab.
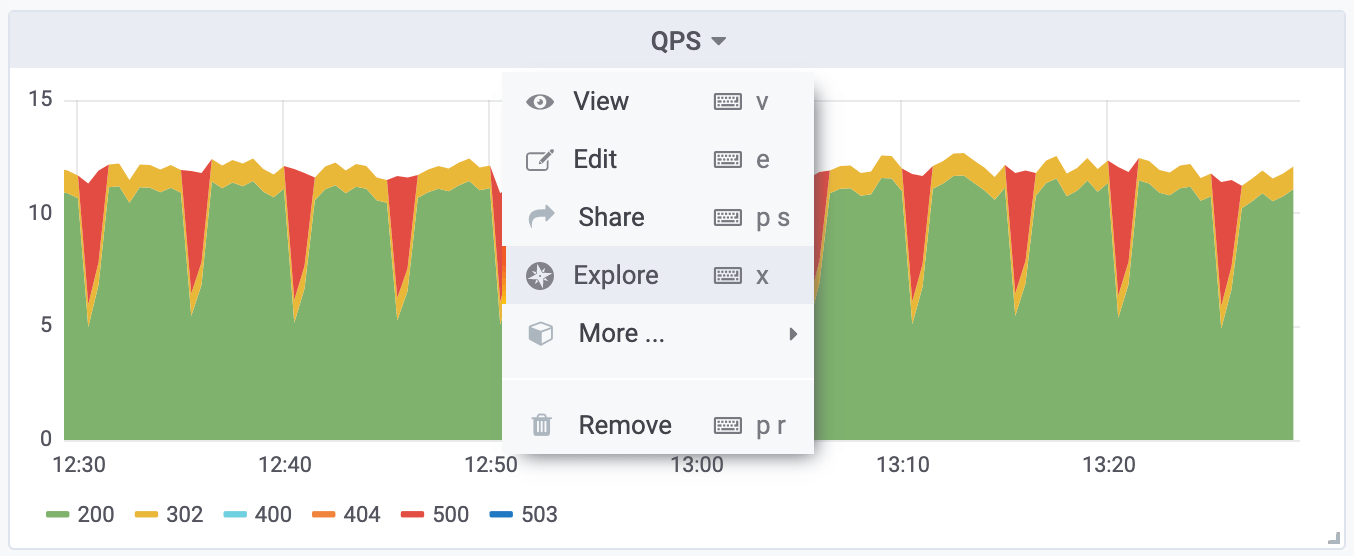
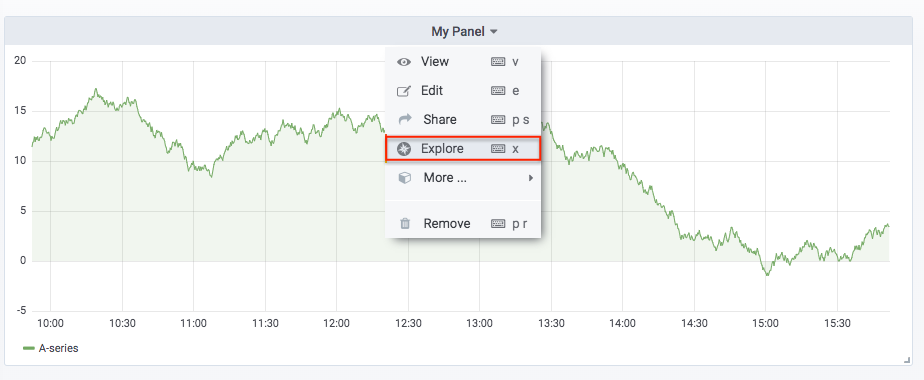
If you want to start with an existing query in a panel, choose the Explore option from the Panel menu. This opens an Explore tab with the query from the panel and allows you to tweak or iterate in the query outside of your dashboard.
Choose your data source from the dropdown in the top left.
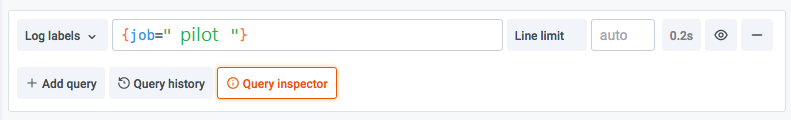
The query field is where you can write your query and explore your data. There are three buttons beside the query field, a clear button (X), an add query button (+) and the remove query button (-). Just like the normal query editor, you can add and remove multiple queries.
The split view feature is an easy way to compare graphs and tables side-by-side or to look at related data together on one page. Click the split button to duplicate the current query and split the page into two side-by-side queries. It is possible to select another data source for the new query which for example, allows you to compare the same query for two different servers or to compare the staging environment to the production environment.
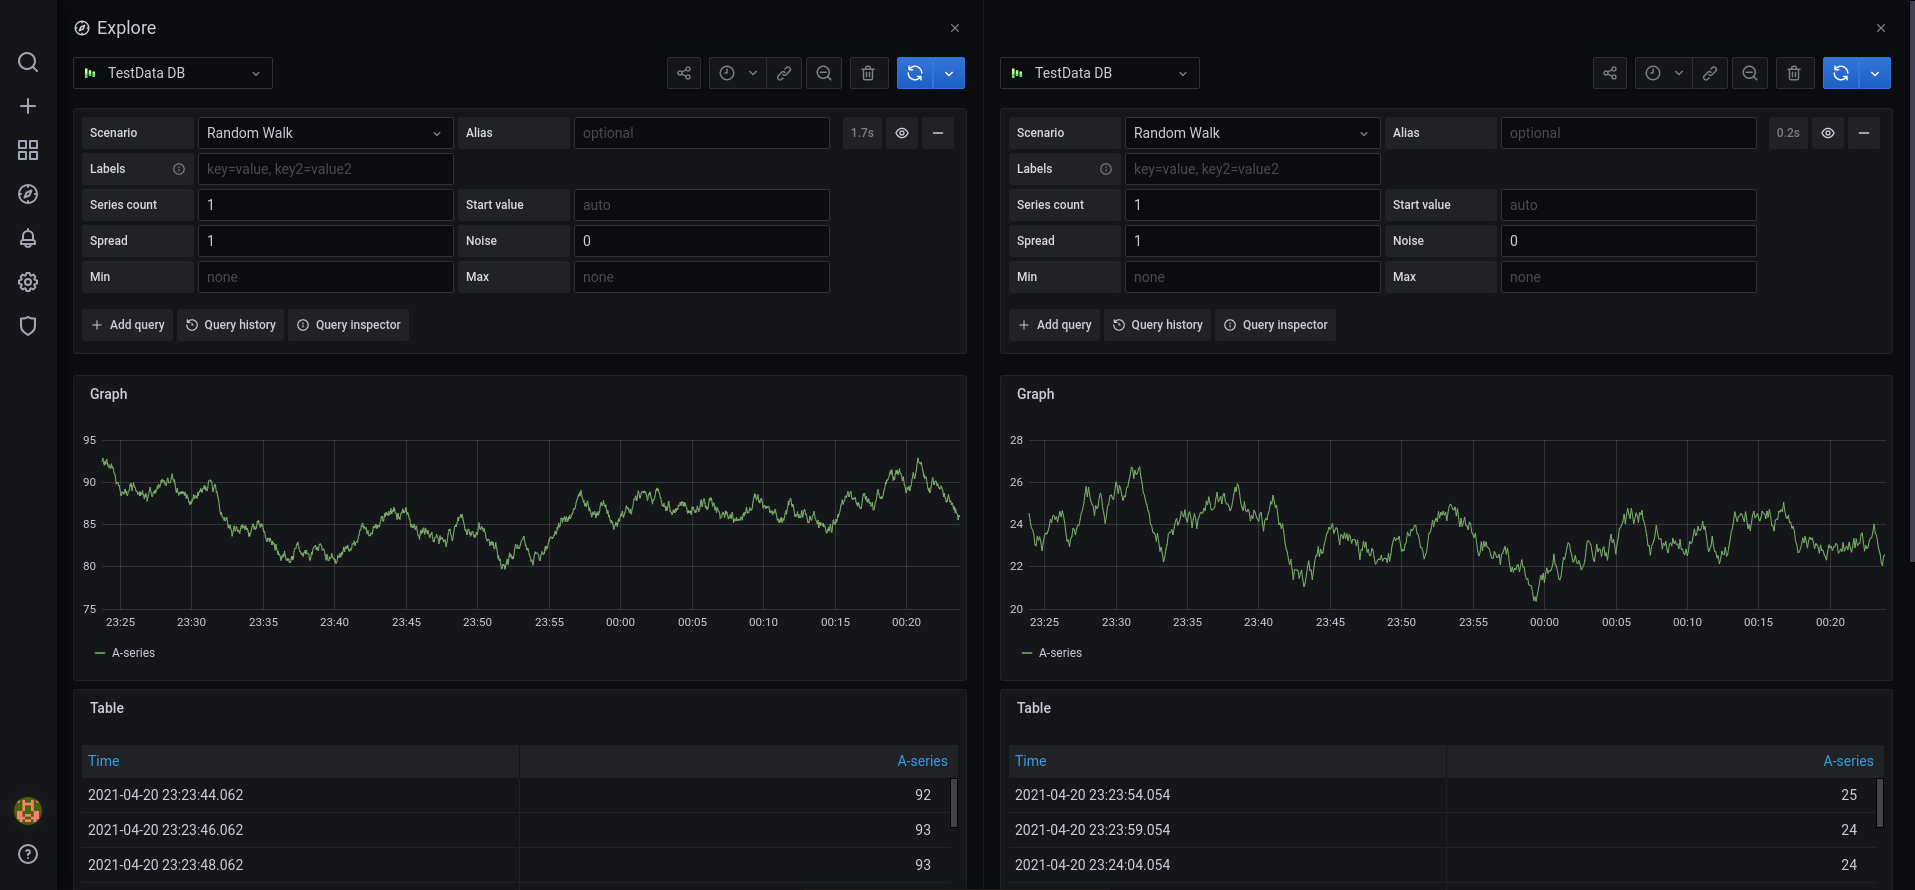
In split view, timepickers for both panels can be linked (if you change one, the other gets changed as well) by clicking on one of the time-sync buttons attached to the timepickers. Linking of timepickers helps with keeping the start and the end times of the split view queries in sync and it will ensure that you’re looking at the same time interval in both split panels.
You can close the newly created query by clicking on the Close Split button.
Share shortened link is only available in DranSCADA 7.3 and above.
The Share shortened link capability allows you to create smaller and simpler URLs of the format /goto/:uid instead of using longer URLs containing complex query parameters. You can create a shortened link by clicking on the Share option in Explore toolbar.
Query history is a list of queries that you have used in Explore. The history is local to your browser and is not shared. To open and interact with your history, click the Query history button in Explore.
Query history lets you view the history of your querying. For each individual query, you can:
- Run a query.
- Create and/or edit a comment.
- Copy a query to the clipboard.
- Copy a shortened link with the query to the clipboard.
- Star a query.
All queries that have been starred in the Query history tab are displayed in the Starred. This allows you to access your favorite queries faster and to reuse these queries without typing them from scratch.
By default, query history shows you the most recent queries. You can sort your history by date or by data source name in ascending or descending order.
- Click the Sort queries by field.
- Select one of the following options:
- Newest first
- Oldest first
- Data source A-Z
- Data source Z-A
Note: If you are in split mode, then the chosen sorting mode applies only to the active panel.
Filter query history in Query history and Starred tab by data source name:
- Click the Filter queries for specific data source(s) field.
- Select the data source for which you would like to filter your history. You can select multiple data sources.
In Query history tab it is also possible to filter queries by date using the slider:
- Use vertical slider to filter queries by date.
- By dragging top handle, adjust start date.
- By dragging top handle, adjust end date.
Note: If you are in split mode, filters are applied only to your currently active panel.
You can search in your history across queries and your comments. Search is possible for queries in the Query history tab and Starred tab.
- Click the Search queries field.
- Type the term you are searching for into search field.
You can customize the query history in the Settings tab. Options are described in the table below.
| Setting | Default value |
|---|---|
| Period of time for which DranSCADA will save your query history | 1 week |
| Change the default active tab | Query history tab |
| Only show queries for data source currently active in Explore | True |
| Clear query history | Permanently deletes all stored queries. |
Note: Query history settings are global, and applied to both panels in split mode.
Only available in DranSCADA v7.0+.
You can visualize traces from tracing data sources in explore. Data sources currently supported:
For information about how to use the query editor see documentation for specific data source.
- Header title: Shows the name of the root span and trace ID.
- Search: Highlights spans containing the searched text.
- Metadata: Various metadata about the trace.
Shows condensed view or the trace timeline. Drag your mouse over the minimap to zoom into smaller time range. Zooming will also update the main timeline, so it is easy to see shorter spans. Hovering over the minimap, when zoomed, will show Reset Selection button which resets the zoom.
Shows list of spans within the trace. Each span row consists of these components:
- Expand children button: Expands or collapses all the children spans of selected span.
- Service name: Name of the service logged the span.
- Operation name: Name of the operation that this span represents.
- Span duration bar: Visual representation of the operation duration within the trace.
Clicking anywhere on the span row shows span details.
- Operation name
- Span metadata
- Tags: Any tags associated with this span.
- Process metadata: Metadata about the process that logged this span.
- Logs: List of logs logged by this span and associated key values.
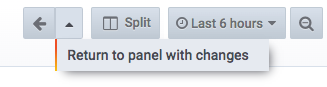
To help accelerate workflows that involve regularly switching from Explore to a dashboard and vice-versa, we’ve added the ability to return to the origin dashboard after navigating to Explore from the panel’s dropdown.
After you’ve navigated to Explore, you should notice a “Back” button in the Explore toolbar.

Simply clicking the button will return you to the origin dashboard, or, if you’d like to bring changes you make in Explore back to the dashboard, simply click the arrow next to the button to reveal a “Return to panel with changes” menu item.
To help with debugging queries, Explore allows you to investigate query requests and responses, as well as query statistics, via the Query inspector. This functionality is similar to the panel inspector Stats tab and Query tab.